The Analytics dashboard provides an overview of your helpdesk activity, including conversations, customer ratings, form submissions, inbox activity, knowledge base searches, and team performance.
From your helpdesk, click the Helpdesk icon in the sidebar to open the Analytics dashboard.
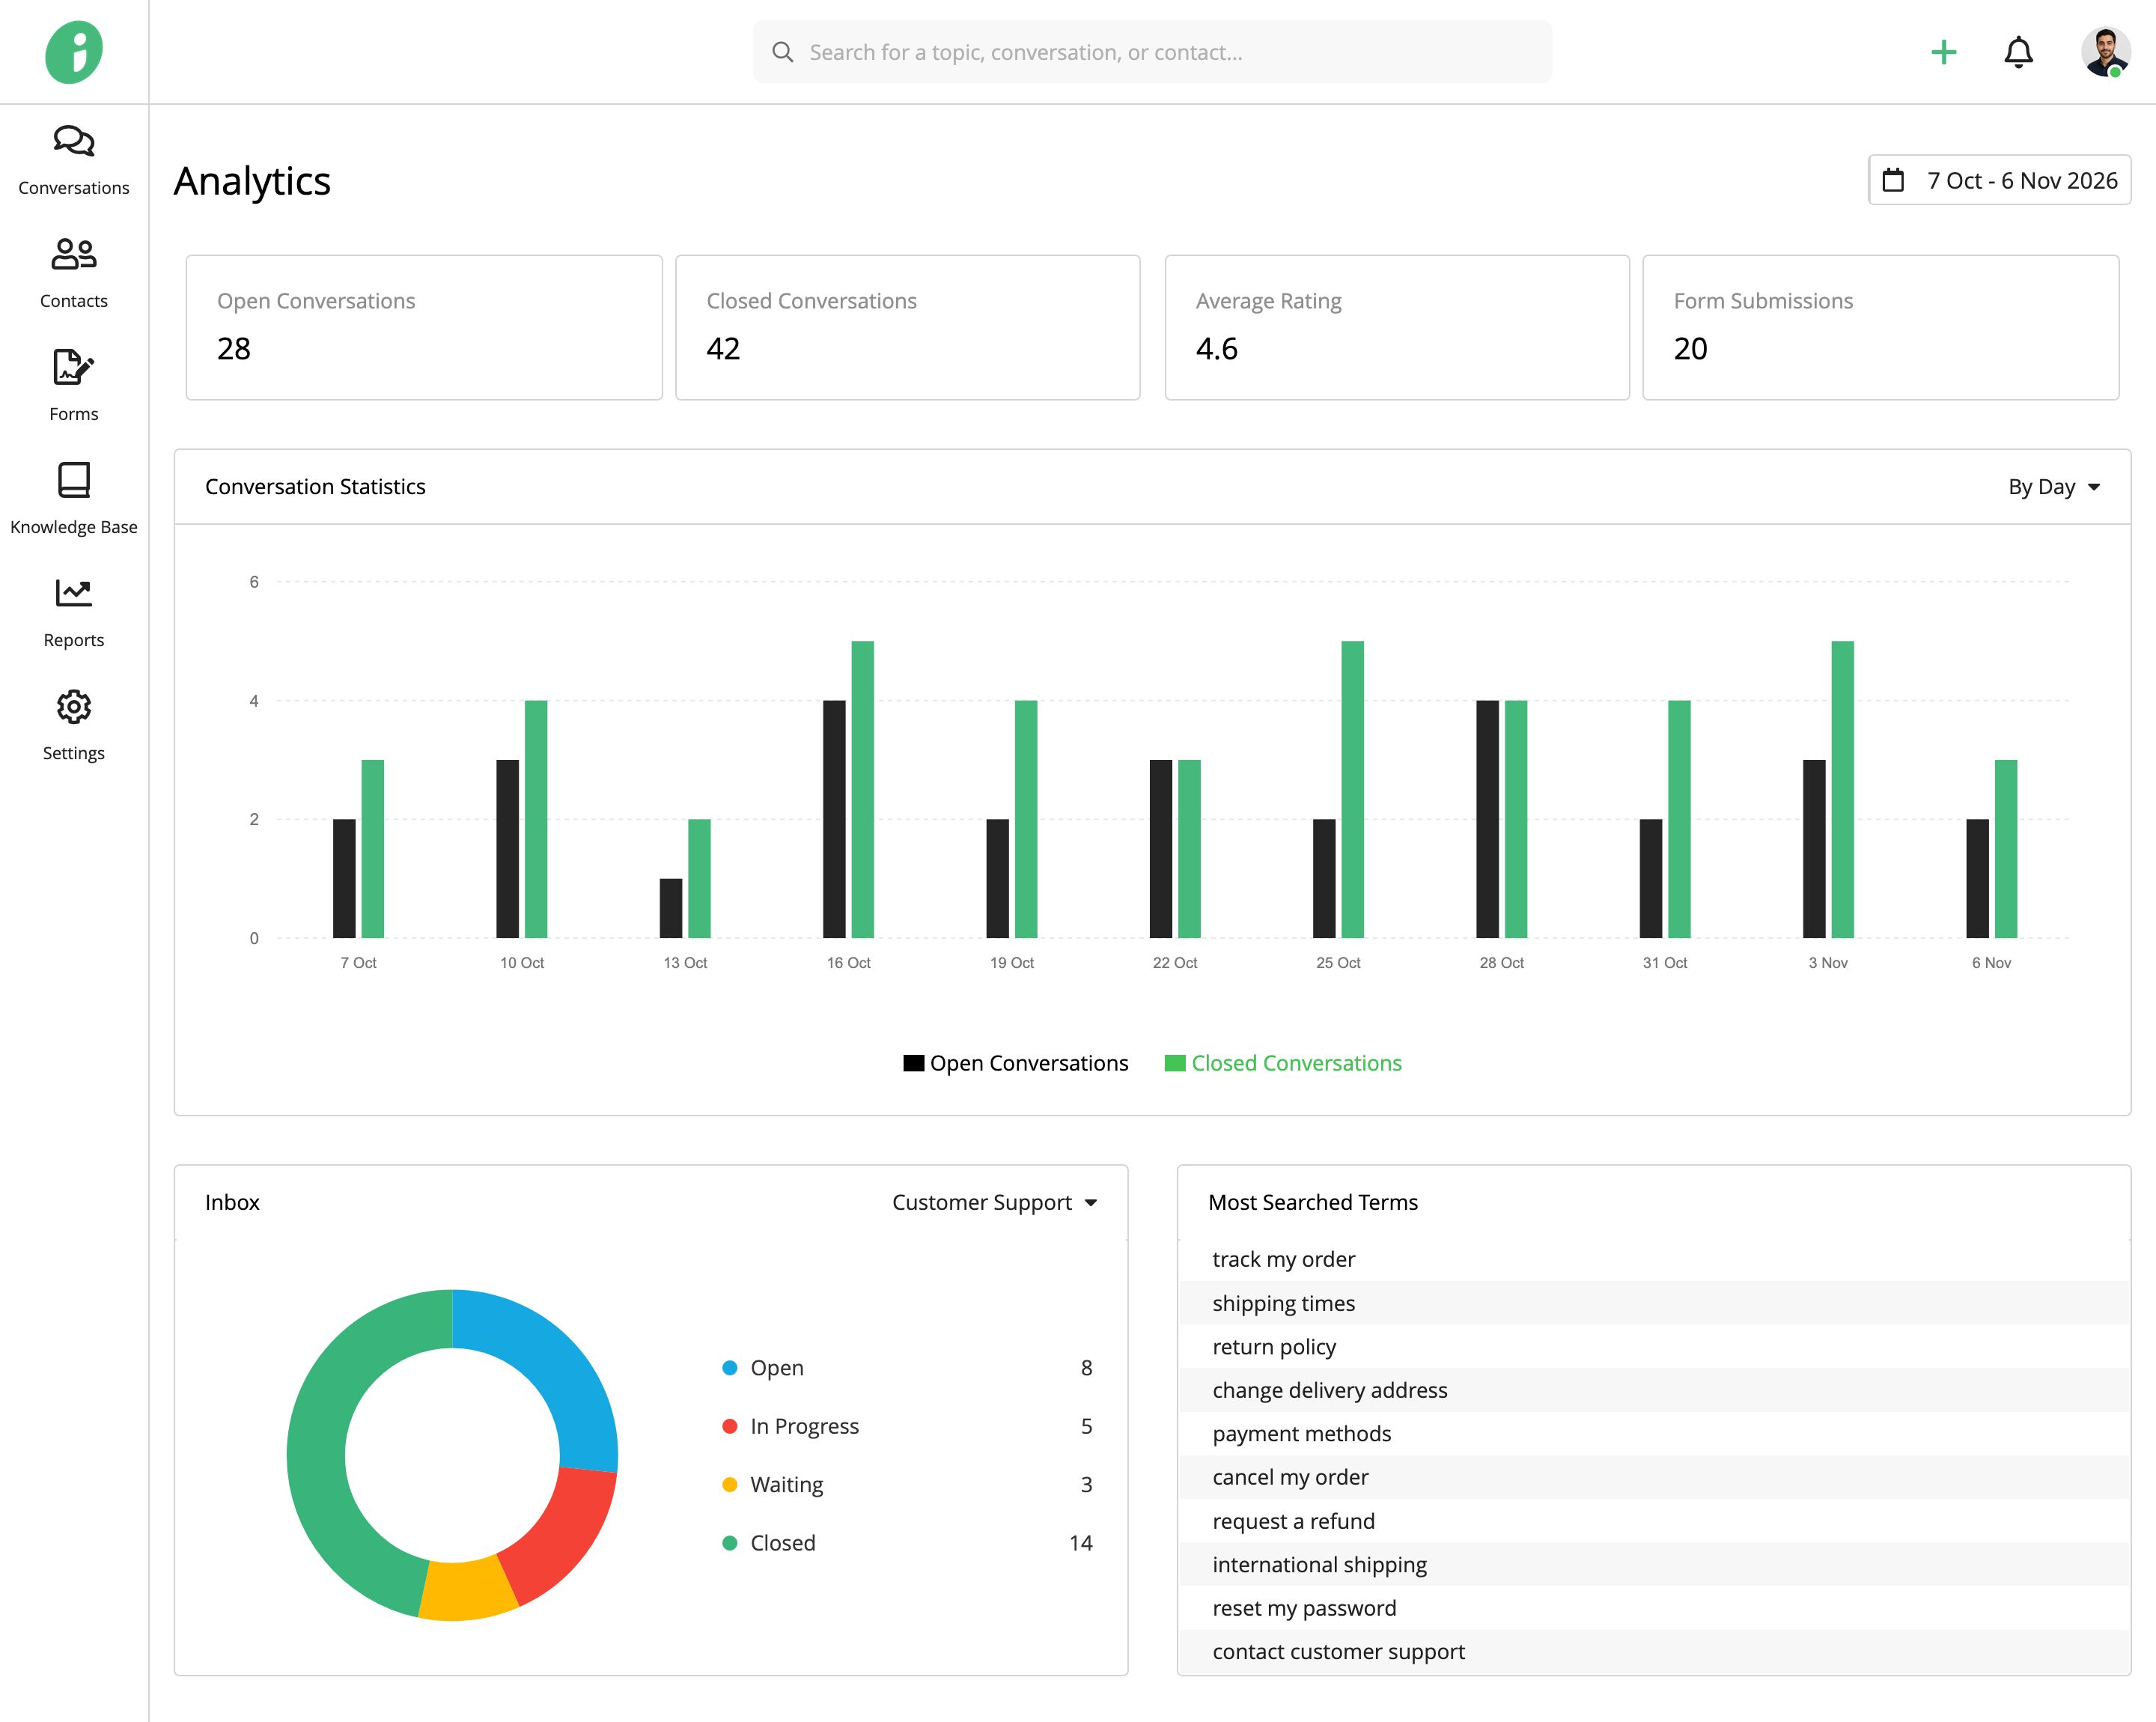
Overview
The four summary cards at the top display Open Conversations, Closed Conversations, Average Rating, and Form Submissions for the selected date range.
Conversation Statistics
The Conversation Statistics chart shows open and closed conversation activity over time. Use the dropdown to group results By Day, By Month, or By Year.
For a detailed breakdown, see View Conversation Statistics.
Inbox Statistics
The Inbox section shows how conversations are distributed across the statuses configured in your helpdesk.
Use the dropdown to switch between inboxes and view the status distribution for each one.
Most Searched Terms
This section highlights the searches visitors make in your knowledge base. Click Most Searched Terms to open the detailed report.
Team Performance
The four charts at the bottom of the dashboard compare performance across teams:
- Average Rating: The average customer rating received by each team.
- Average Resolution Time: The average time taken by each team to resolve a conversation.
- Average Response Time: The average time between customer messages and team responses.
- Average First Response Time: The average time between a conversation starting and the team's first response.
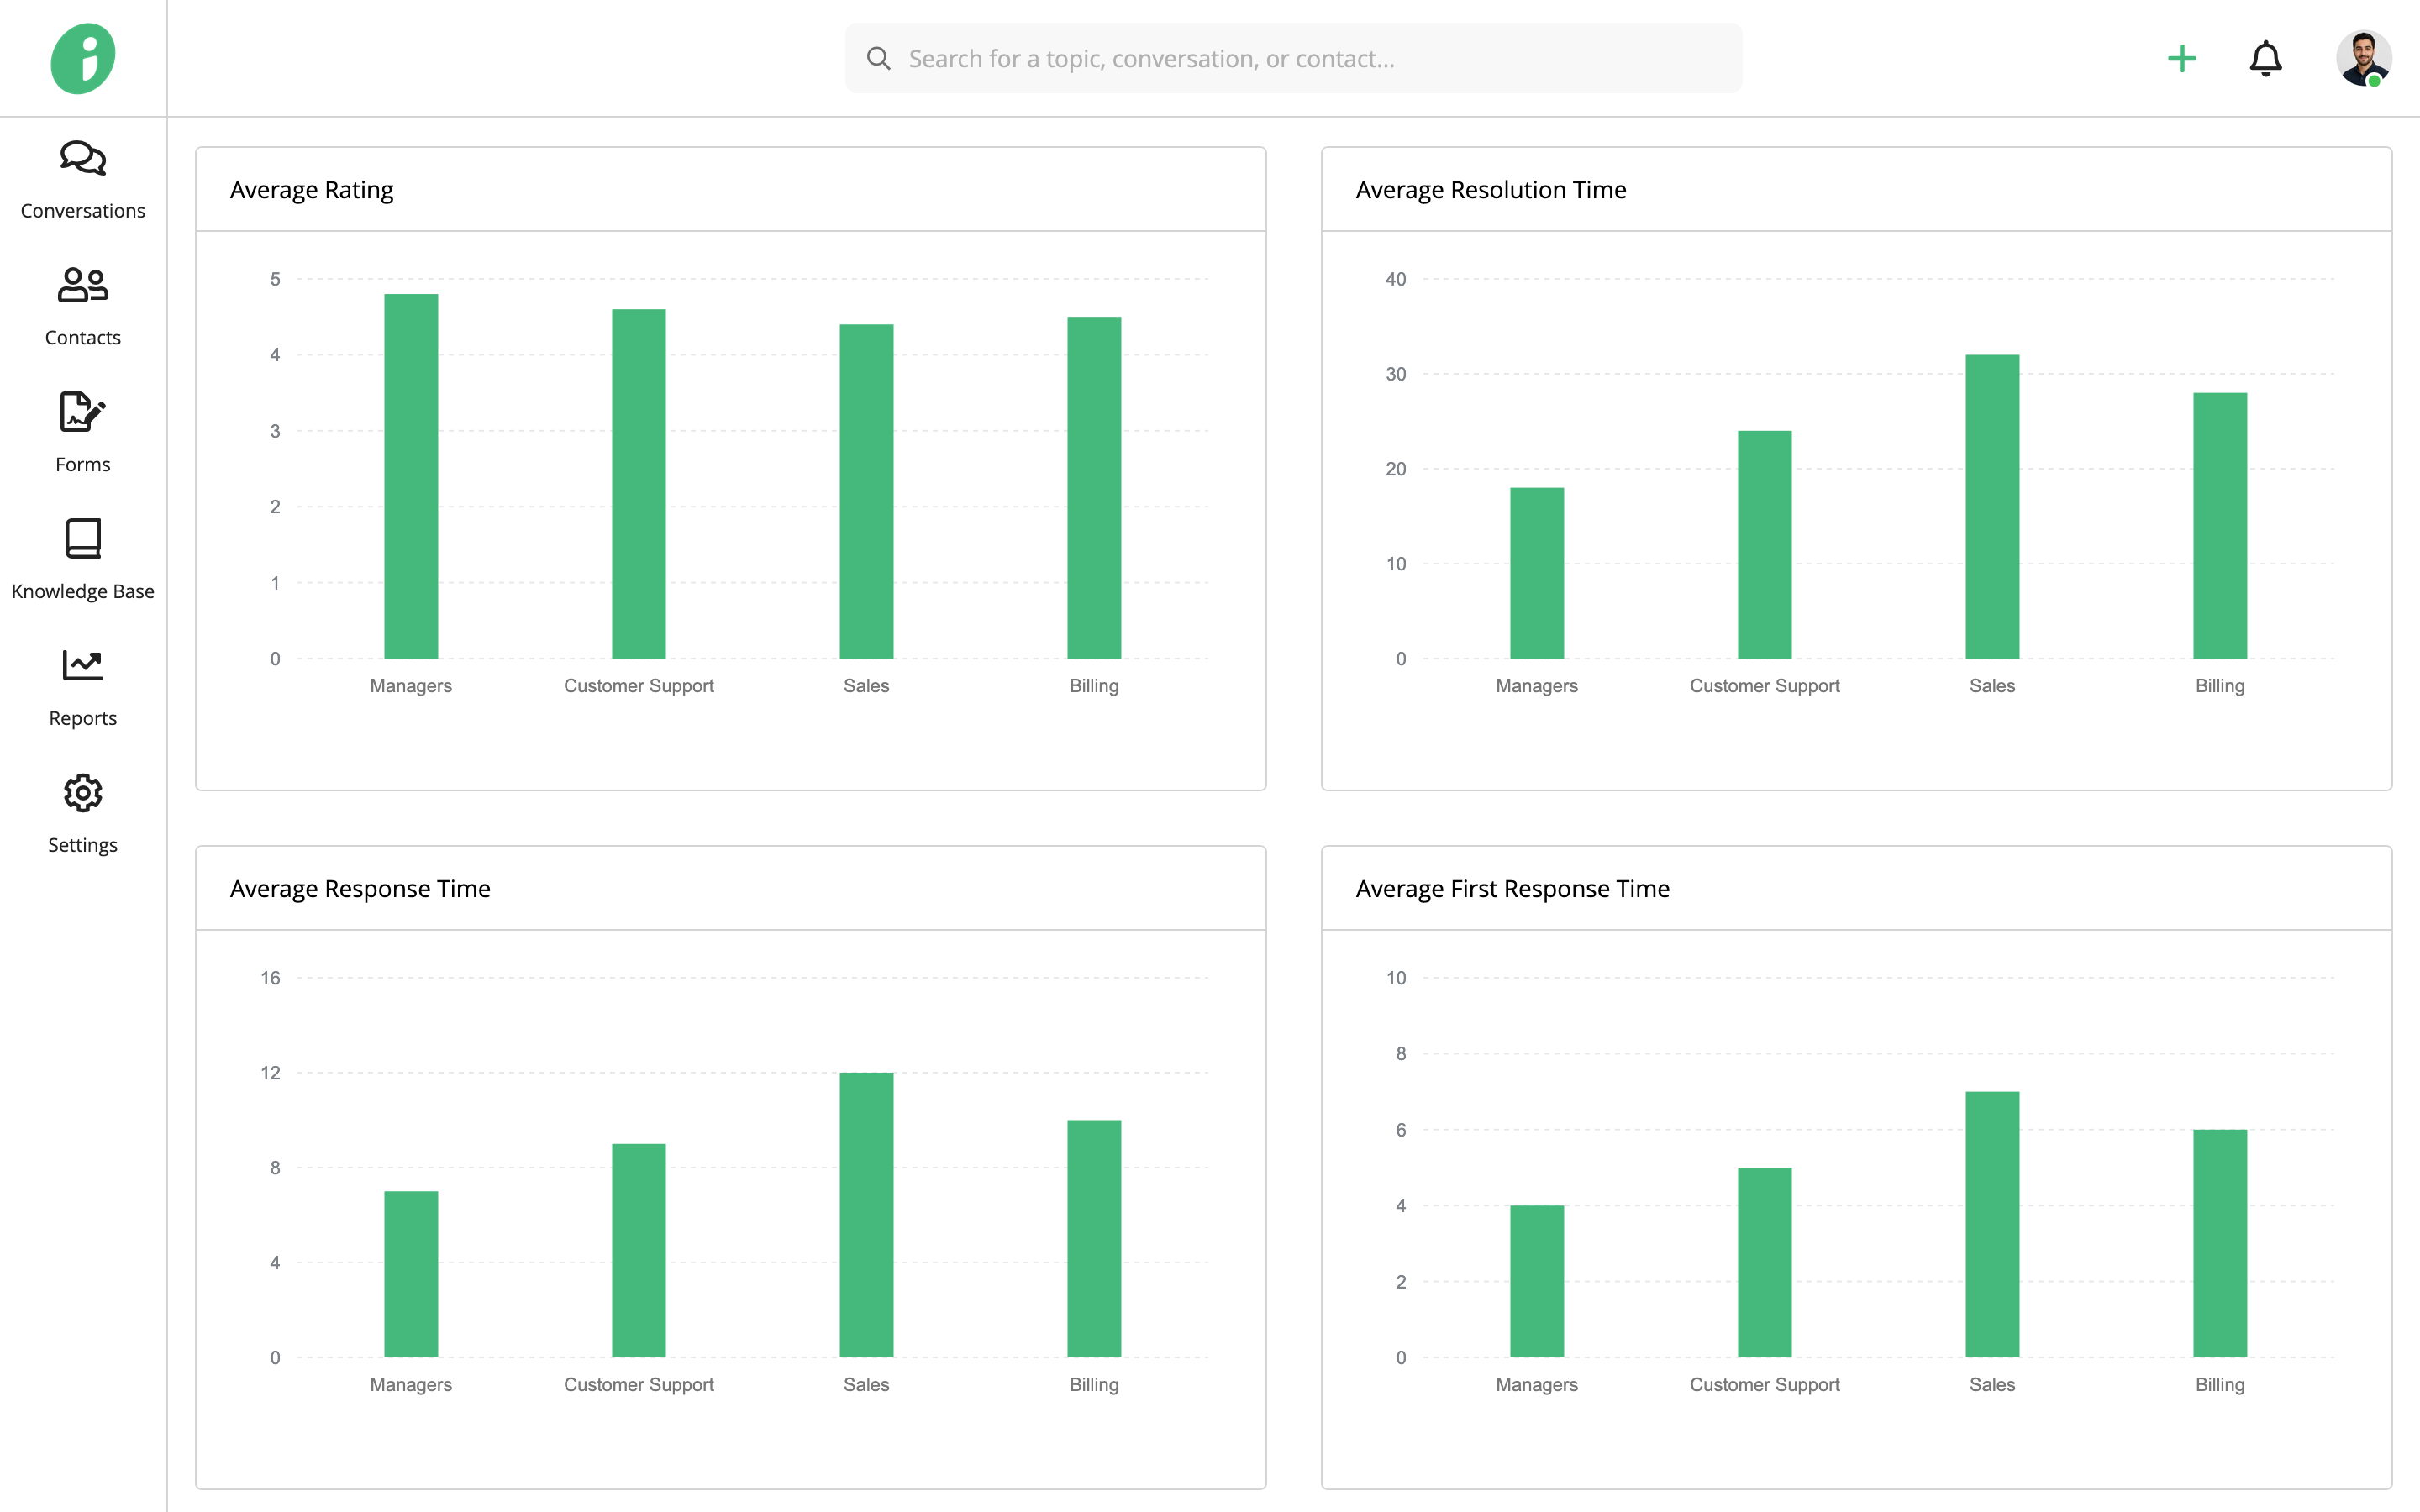
Hover over any bar to view the team name and its corresponding average rating or time value.
Select a Date Range
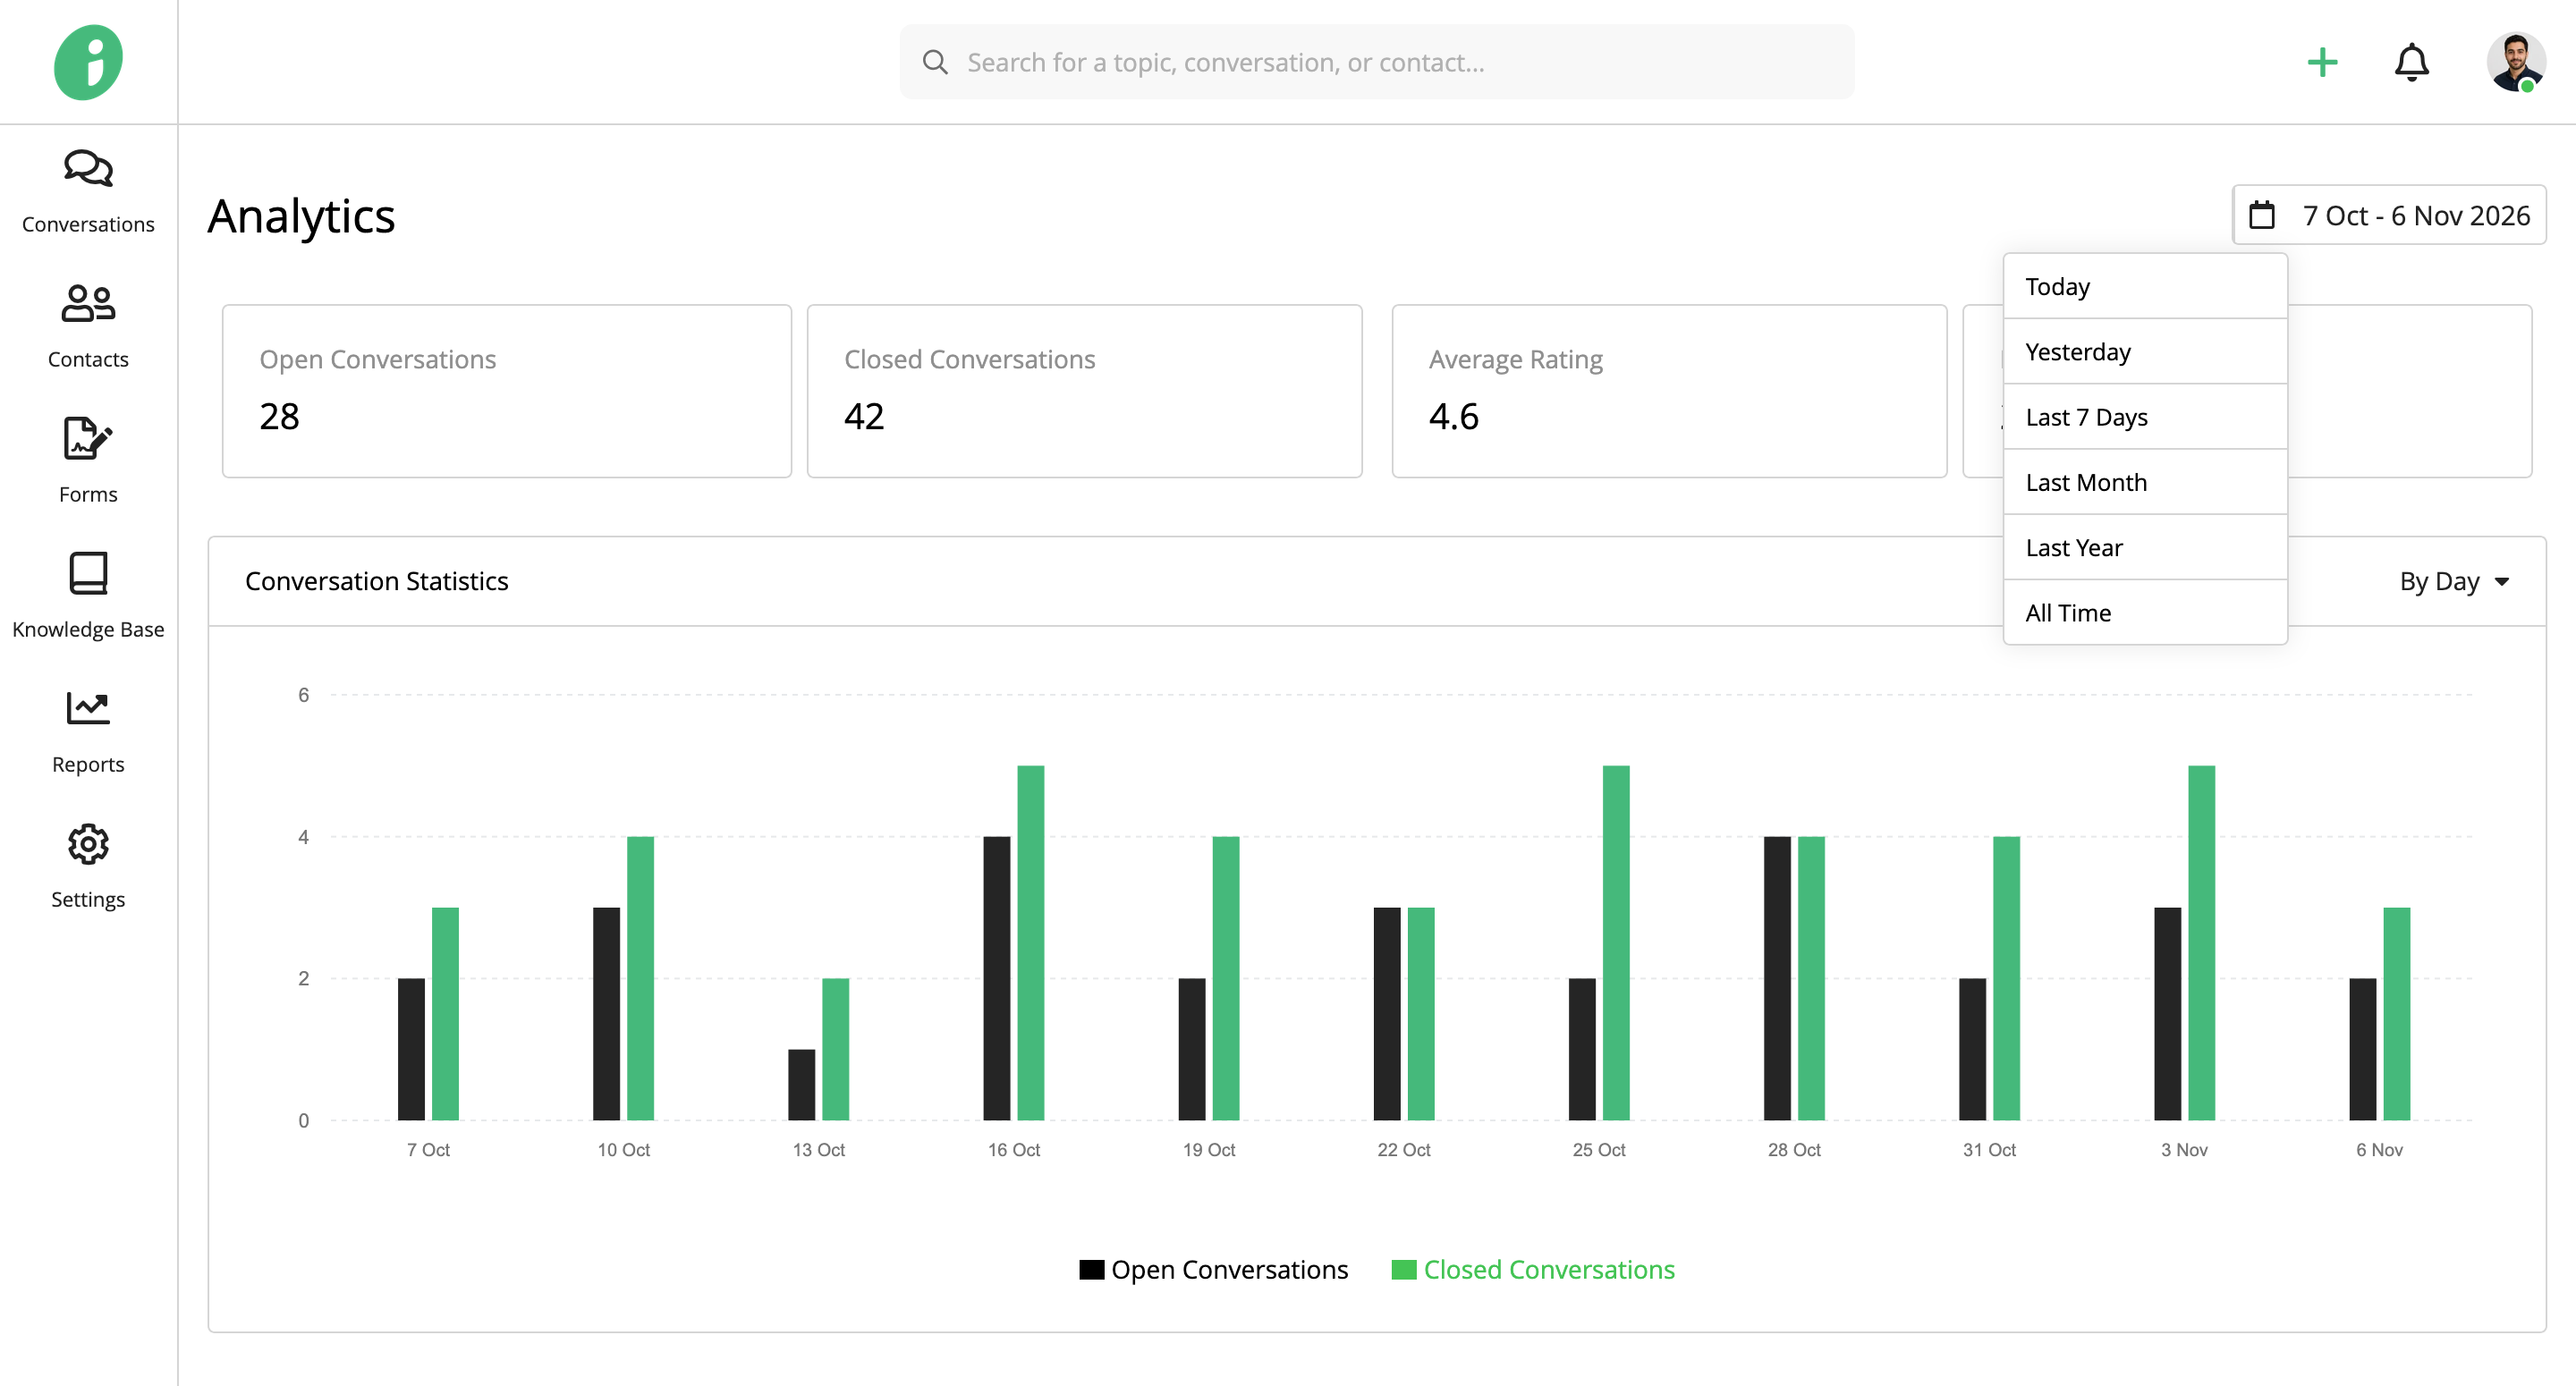
Click the calendar icon to choose a predefined period: Today, Yesterday, Last 7 Days, Last Month, Last Year, or All Time.
To specify a custom period, click the date range and select the start and end dates from the calendar.
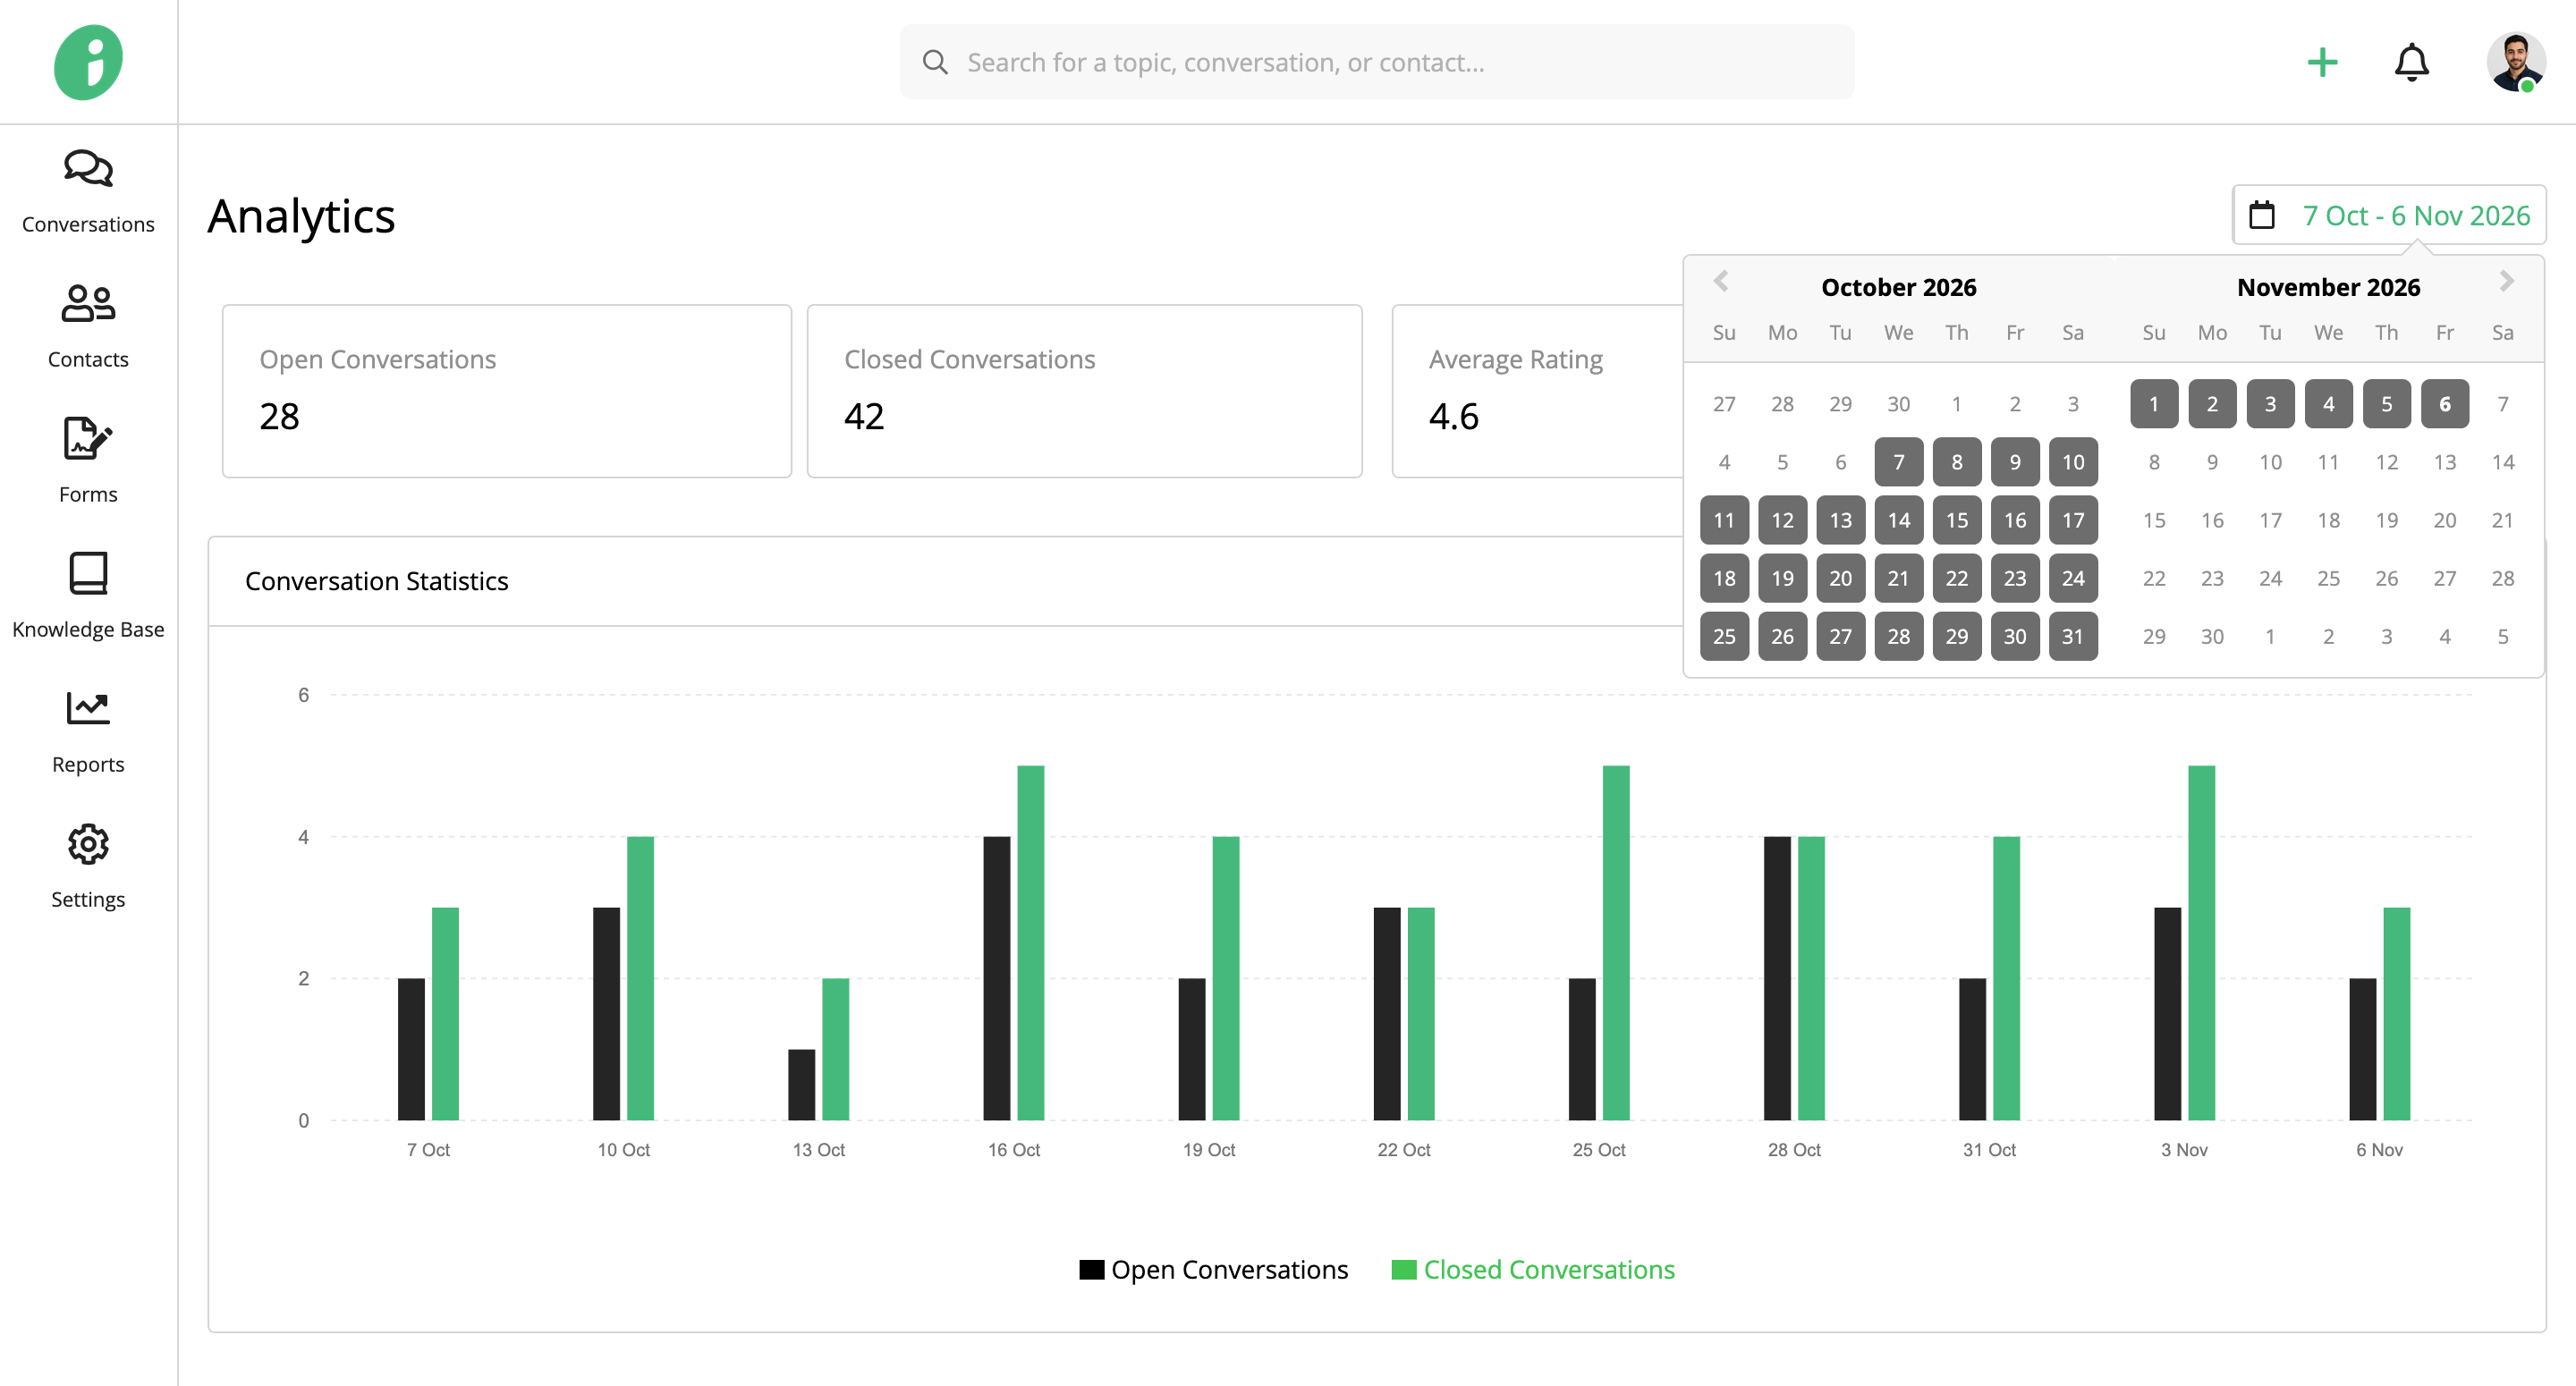
The selected date range applies to all dashboard statistics and charts.